Breakdown of MLS reported sales for 12 luxury areas analyzed by price points with year supply estimates. This detailed information provides important indicators for pricing and marketing strategies for buyers and sellers. Rancho Santa Fe, Del Mar, La Jolla, Carmel Valley, Carlsbad, Coronado, Encinitas, Solana Beach, Poway, Downtown San Diego, Point Loma and Rancho Bernardo/Santaluz/4S Ranch.
Created by: Michael Taylor, Berkshire Hathaway HomeServices California Properties
JULY Issue breakdown includes sales through 6/15/2018
Rancho Santa Fe Luxury Real Estate (92067, 92091)
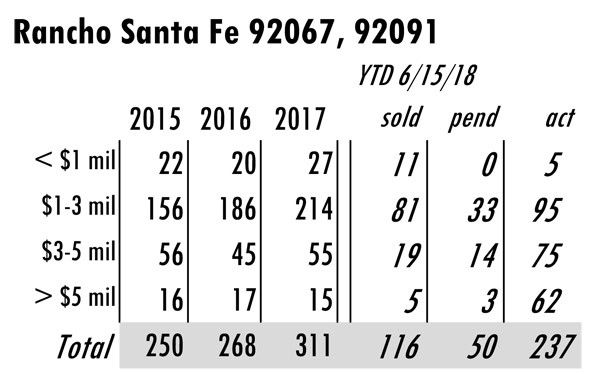
JULY Issue Rancho Santa Fe total MLS reported sales, active listings, month’s inventory supply, and median sales price** compared to the same period last year.
June 15, 2018 Total Sales = 116 June 15, 2017 Total Sales = 125
SALES = down 7% INVENTORY = down 5%
La Jolla Luxury Real Estate (92037)
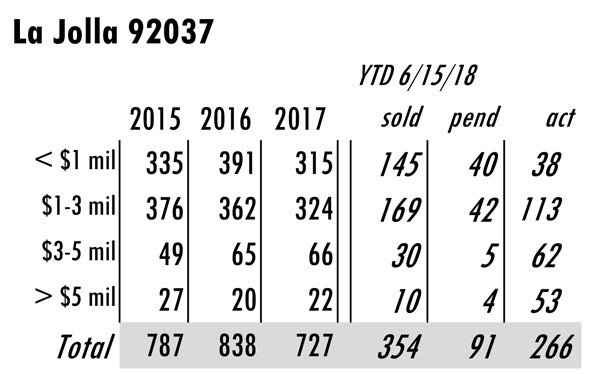
JULY Issue La Jolla total MLS reported sales, active listings, month’s inventory supply, and median sales price** compared to the same period last year.
June 15, 2018 Total Sales = 354 June 15, 2017 Total Sales = 317
SALES = UP 12% INVENTORY = down 9%
Del Mar Luxury Real Estate (92014)
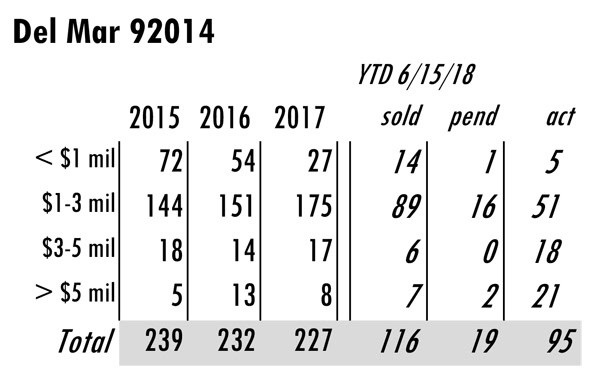
JULY Issue Del Mar total MLS reported sales, active listings, month’s inventory supply, and median sales price** compared to the same period last year.
June 15, 2018 Total Sales = 116 June 15, 2017 Total Sales = 99
SALES = UP 17% INVENTORY = down 10%
Carmel Valley Luxury Real Estate (92130)
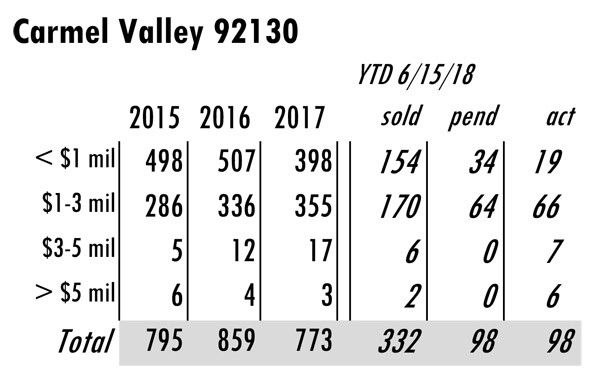
JULY Issue Carmel Valley total MLS reported sales, active listings, month’s inventory supply, and median sales price** compared to the same period last year.
June 15, 2018 Total Sales = 332 June 15, 2017 Total Sales = 356
SALES = down 7% INVENTORY = down 15%
Carlsbad Luxury Real Estate (92008,92009, 92010, 92011)
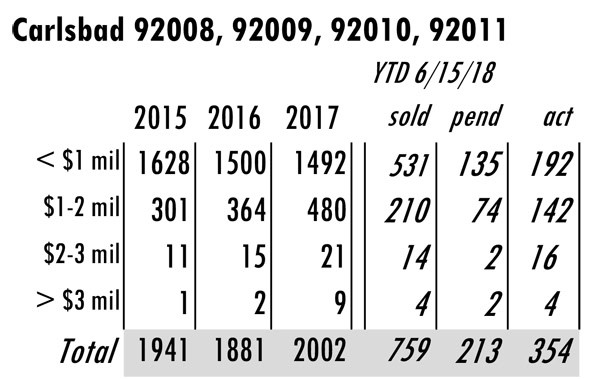
JULY Issue Carlsbad total MLS reported sales, active listings, month’s inventory supply, and median sales price** compared to the same period last year.
June 15, 2018 Total Sales = 759 June 15, 2017 Total Sales = 917
SALES = down 17% INVENTORY = Up 12%
Encinitas Luxury Real Estate (92024)
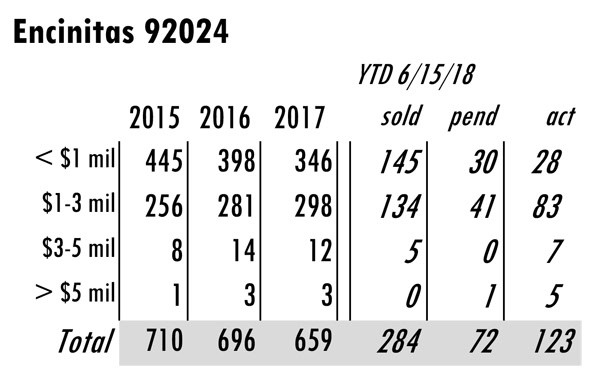
JULY Issue Encinitas total MLS reported sales, active listings, month’s inventory supply, and median sales price** compared to the same period last year.
June 15, 2018 Total Sales = 284 June 15, 2017 Total Sales = 287
SALES = Essentially Even INVENTORY = Essentially Even
Solana Beach Luxury Real Estate (92075)
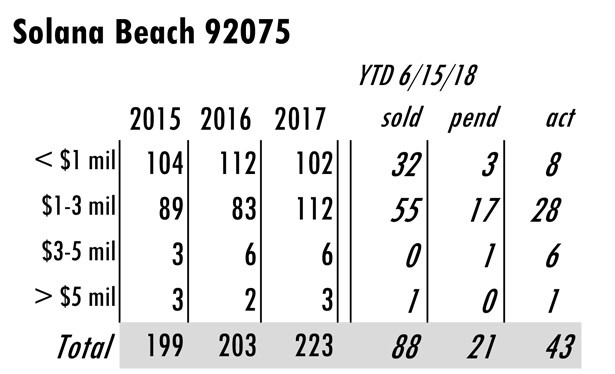
JULY Issue Solana Beach total MLS reported sales, active listings, month’s inventory supply, and median sales price** compared to the same period last year.
June 15, 2018 Total Sales = 88 June 15, 2017 Total Sales = 105
SALES = down 16% INVENTORY = Up 10%
Rancho Bernardo Luxury Real Estate (92127, 92128)
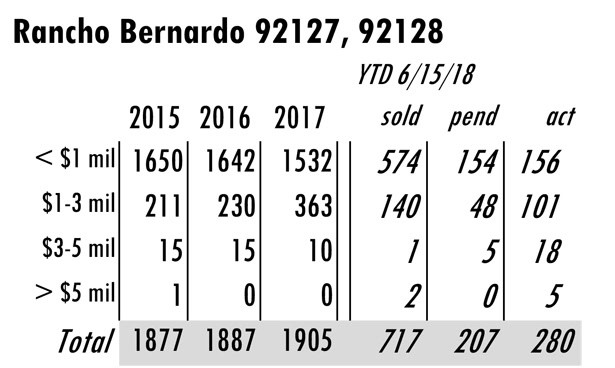
JULY Issue Rancho Bernardo total MLS reported sales, active listings, month’s inventory supply, and median sales price** compared to the same period last year.
June 15, 2018 Total Sales = 717 June 15, 2017 Total Sales = 875
SALES = down 18% INVENTORY = Up 24%
Poway Luxury Real Estate (92064)
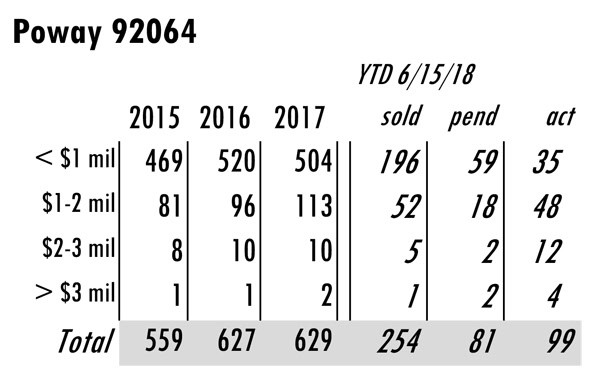
JULY Issue Poway total MLS reported sales, active listings, month’s inventory supply, and median sales price** compared to the same period last year.
June 15, 2018 Total Sales = 254 June 15, 2017 Total Sales = 279
SALES = down 9% INVENTORY = Essentially Even
Coronado Luxury Real Estate (92118)
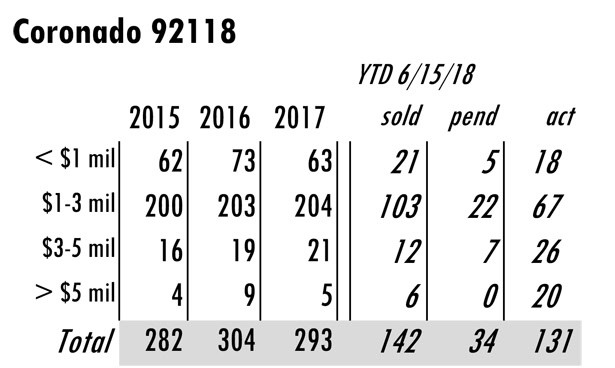
JULY Issue Coronado total MLS reported sales, active listings, month’s inventory supply, and median sales price** compared to the same period last year.
June 15, 2018 Total Sales = 142 June 15, 2017 Total Sales = 132
SALES = UP 8% INVENTORY = down 8%
Point Loma Luxury Real Estate (92106)
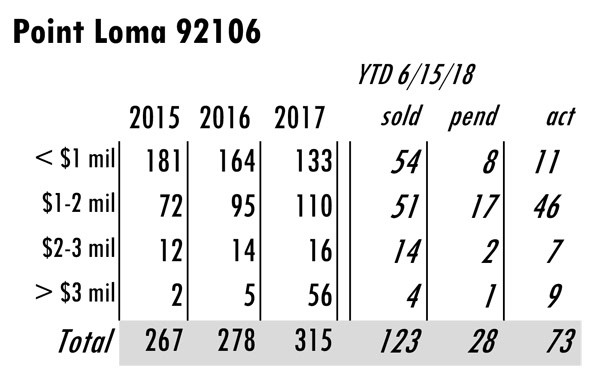
JULY Issue Point Loma San Diego total MLS reported sales, active listings, month’s inventory supply, and median sales price** compared to the same period last year.
June 15, 2018 Total Sales = 123 June 15, 2017 Total Sales = 111
SALES = UP 11% INVENTORY = UP 4%
Downtown San Diego Luxury Real Estate (92101)
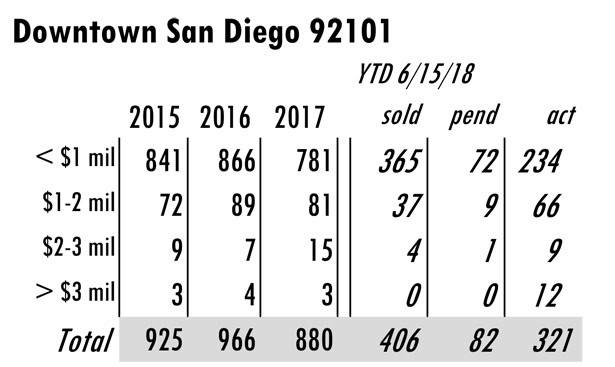
JULY Issue Downtown San Diego total MLS reported sales, active listings, month’s inventory supply, and median sales price** compared to the same period last year.
June 15, 2018 Total Sales = 406 June 15, 2017 Total Sales = 366
SALES = UP 11% INVENTORY = UP 38%
Based on MLS data from these zip codes, 92067,92091,92014,92037,92130,92118,92024,92127,92128, 92008,92009,92010,92011,9075,92064,92101 for the period of 1/1/2004 – 6/15/2018.