MARCH ISSUE Breakdown of MLS reported sales for these luxury areas analyzed by price points with year supply estimates.
Breakdown of MLS reported sales for 8 luxury areas analyzed by price points with year supply estimates. This detailed information provides important indicators for pricing and marketing strategies for buyers and sellers. Rancho Santa Fe, Del Mar, La Jolla, Carmel Valley, Coronado, Encinitas, Rancho Bernardo/Santaluz/4S Ranch, and Downtown.
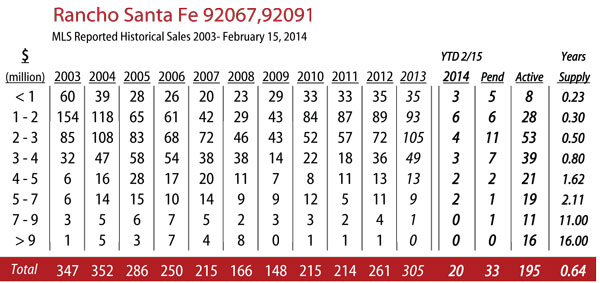
Rancho Santa Fe Luxury Real Estate
Total sales 2/15/2014 = 20 2/15/2013 = 30
Active Listings 2/15/2014 = 195 2/15/2013 = 186
Month(s) Supply 2/15/2014 = 7.5 month 2/15/2013 = 8.5 month
Sales, 10 less than 2013 Inventory UP 5%
Click here for Rancho Santa Fe historical sales compared by price range 2003- 2013 < $1 million, $1 – $3 million, $3 – $5 million, > $5 million
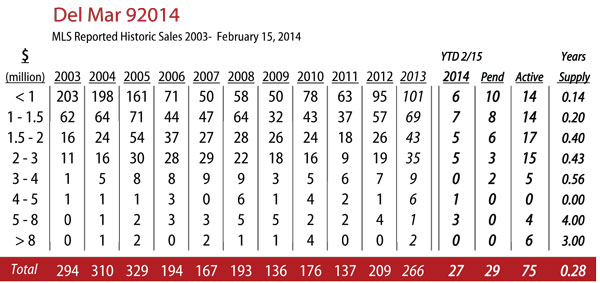
Del Mar Luxury Real Estate
Total sales 2/15/2014 = 27 2/15/2013 = 21
Active Listings 2/15/2014 = 75 2/15/2013 = 72
Month(s) Supply 2/15/2014 = 3.5 month 2/15/2013 = 4 month
Sales UP 29% Inventory Essentially Even
Click here for Del Mar historical sales compared by price range 2003- 2013 < $1 million, $1 – $2 million, > $2 million
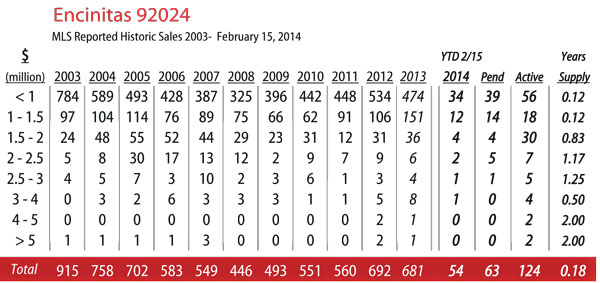
Encinitas Luxury Real Estate
Total sales 2/15/2014 = 54 2/15/2013 = 55
Active Listings 2/15/2014 = 124 2/15/2013 = 105
Month(s) Supply 2/15/2014 = 2 month 2/15/2013 = Just under 2 month
Sales Essentially Even Inventory UP 18%
Click here for Encinitas historical sales compared by price range 2003-2013 < $1 million, $1 – $2 million, > $2 million
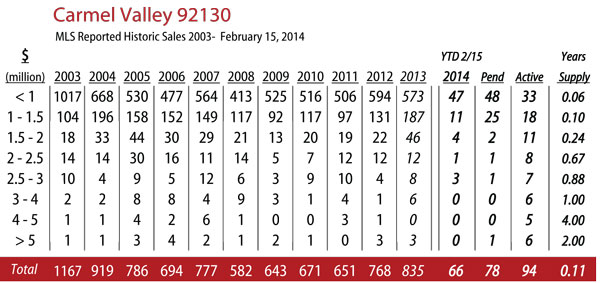
Carmel Valley Luxury Real Estate
Total sales 2/15/2014 = 66 2/15/2013 = 76
Active Listings 2/15/2014 = 94 2/15/2013 = 59
Month(s) Supply 2/15/2014 = 1 month 2/15/2013 = 1 month
Sales 10 Less than 2013 Inventory UP 59%
Click here for Carmel Valley historical sales compared by price range < $1 million, $1 – $2 million, > $2 million
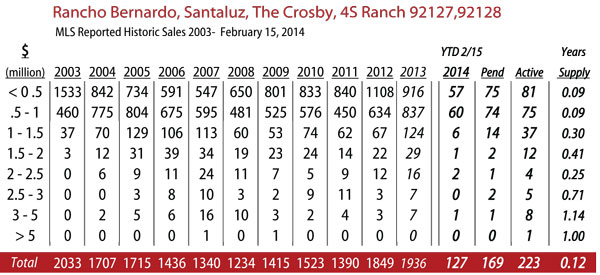
Rancho Bernardo Luxury Real Estate
Total sales 2/15/2014 = 127 2/15/2013 = 137
Active Listings 2/15/2014 = 223 2/15/2013 = 102
Month(s) Supply 2/15/2014 = 1.5 month 2/15/2013 = Less than 1 month
Sales 10 Less than 2013 Inventory UP 119%
Click here for RB historical sales compared by price range < $0.5 million, $0.5 – $1 million, > $1 million
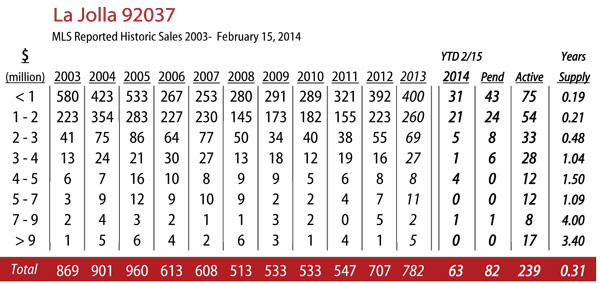
La Jolla Luxury Real Estate
Total sales 2/15/2014 = 63 2/15/2013 = 59
Active Listings 2/15/2014 = 239 2/15/2013 = 233
Month(s) Supply 2/15/2014 = 3.5 month 2/15/2013 = 4 month
Sales, UP 7% Inventory Essentially Even
Click here for La Jolla historical sales compared by price range < $1 million, $1 – $3 million, > $3 million
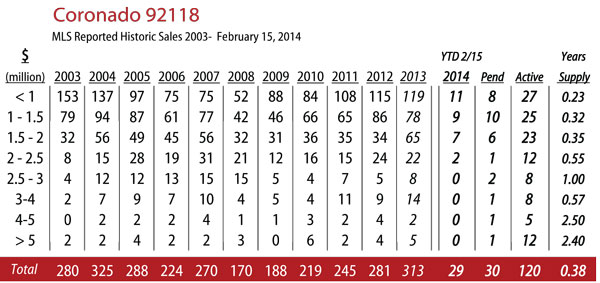
Coronado Luxury Real Estate
Total sales 2/15/2014 = 29 2/15/2013 = 17
Active Listings 2/15/2014 = 120 2/15/2013 = 152
Month(s) Supply 2/15/2014 = 4.5 month 2/15/2013 = 6.5 month
Sales, UP 71% Inventory down 27%
Click here for Coronado historical sales compared by price range < $1 million, $1 – $2 million, > $2 million
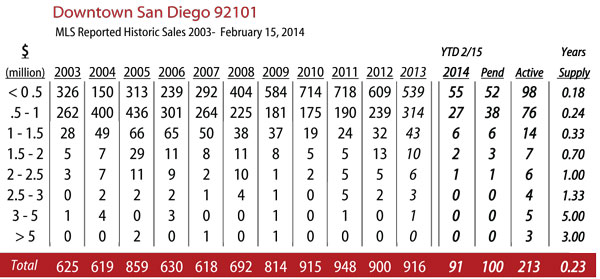
Downtown Luxury Real Estate
Total sales 2/15/2014 = 61 1/15/2014 = 63
Active Listings 2/15/2014 = 213 1/15/2014 = 196
Month(s) Supply 2/15/2014 = 2.5 month 1/15/2014 = 2.5 month
Sales: Essentially Even Inventory UP 9%
Click here for Downtown historical sales compared by price range < $0.5 million, $0.5 – $1 million, > $1 million
*Based on MLS data from these zip codes, 92067,92091,92014,92037,92130,92118, 92024,92127,92128 for the period of 1/01/2013– 2/15/2014. **DataQuick Information deemed reliable but not guaranteed.